
Every good trader sholud have always a “Plan B”.
This is why my forecasts are always drawn with multiple scenarios, in uptrend and downtrend.
Here i show you how the scenarios are drawn on my charts:
TECHNICAL TRADING PLAN
(Orange lines)
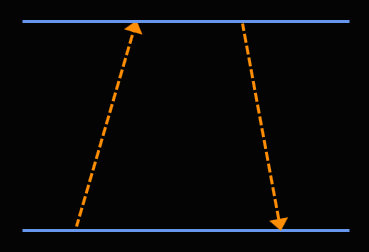
Uptrend or downtrend from/to supports and resistances
WHAT AM I GOING TO TRADE?
After many confirmations, I look for opportunities to enter the market where forecasts on multiple time frames are pointing in the same direction.